Saturday 18 February 2023

What is K-fold Cross Validation? Working of Cross validation on K-fold data.

In this tutorial, we will be covering the cross-validation concept, its usage in machine learning methods, and the working of k-fold cross-validation.


Cross-validation: 

A resampling technique called cross-validation uses several data subsets to evaluate and train a model across a number of iterations. It is typically used in scenarios where the objective is prediction and one aims to evaluate how well a predictive model will perform in real-world situations.

In machine learning, cross-validation is used to compare various models and their parameters such as Support Vector Machine, and Random Forest. Cross-validation can be a good approach in the case of tuning the hyper-parameters of models to identify the best settings and the best model for a given type of problem. K-fold is a specific way of sampling the data for training the model. In k-fold, k refers to the number of groups that the data gets split into. For example, if you have k equal to 10, then the entire data gets split into 10 groups. Further, let's have 1000 data points and have 10 groups then we have hundred (100)  data points for each group.  One thing is that data scaling and normalization need to be done after the split into training and testing, otherwise you may run into data leakage issues.


You can see the k-fold process on the whole dataset. This figure shows how the training and testing data portion is selected for k-fold cross-validation. Here consider k is 5 and the entire data is split into 5 groups. This visualization shows that the first group of data was selected for testing data and the remaining 4 subgroups of data were selected for training in the 1st iteration. Similarly, 2nd group (fold) of data was selected for testing and the other remaining 4 subgroups were selected for training in the 2nd iteration. If we put attention here then we can observe that subgroup selected for testing is relating to the iteration number like in 1st iteration, the first group was selected for testing data, the second group was selected in the 2nd iteration, and so on. This represents the working of k-fold cross-validation.     
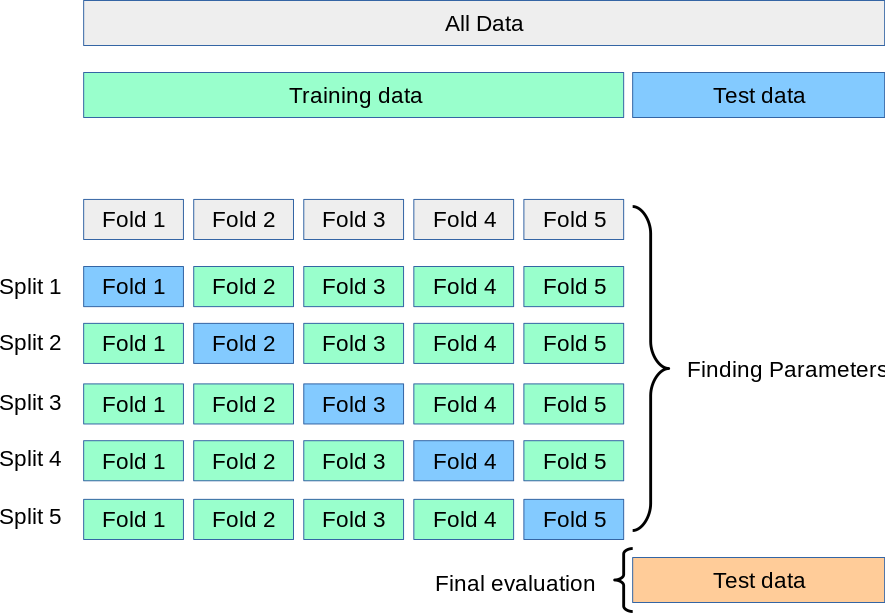
K-fold
Splitting of Data via K-fold


What is a good K value?
There is no straight rule to choose the k value in the k-fold but most of the time, 10 is used for the k value in published papers or any other code. Here you have to remember and ensure one thing the k value results in a representative large enough train and test data.   
Another alternative way to find out the K value can be sensitivity analysis:
Sensitivity analysis can be performed to identify the ideal K value
  • By evaluating the performance of a given model for different k values.
  • For example, Compare the accuracy from different k values against the accuracy of a model trained on almost all the data (k=N). Accuracy may be low for lower k-values and saturate at some specific k-value.    
 

Let's summarize the K-fold split:

  • If the dataset size is 500 data points and k=10
    • Data gets split into 10 folds, and each fold has (500/10 = 50) data points
    • One fold gets used for test/validation and the remaining 9 (k-1) folds are used for training 


How to use K-folds for Cross-Validation?

  • Scikit-learn provides an easy way to perform K-folds splits in python:
                from sklearn.model_selection import KFold
                cv = KFold(n_splits=10, random_state=42, shuffle=True)
  • Cross-validation can be performed either by
    • Iterating over the training and testing splits by deliberately coding using a for loop
                            for train, test in cv.split(all_data):
                                          train the model on each fold
                                          evaluate on the test fold
    • Or using the sklearn.cross_val_score that computes the cross-validation score 
                            scores = cross_val_score(model, X, Y,  cv=10, scoring='accuracy',                                        n_jobs=-1)

Cross-Validation on K-folds

So repeat the above training and evaluation process for all models and corresponding hyperparameters to find the best one.


Summary:

  • The purpose of K-fold cross-validation is:
    • To check the model performance 
    • Not to develop/train a final model
  • Use k=10 (or even) for small data sets and k=5 (or 3) for large data sets
  • Example: You want  to pick the best model among SVM, RF, DT, and Neural Network
    • Perform k-fold cross-validation and identify the one that performs the best
    • Train that specific model with the corresponding best-performing hyperparameters on all data for future use.


Wednesday 25 March 2020

What is Machine Learning? Types of Machine Learning

What is Machine Learning?

Machine Learning is a branch of Artificial Intelligence (AI) that provides systems the ability to learn and improve from the past experience without being explicitly programmed. It is based on the idea that systems can learn from data, identify patterns( using statistical models) and make predictions (decisions) without human intervention.
These systems use algorithms and statistical models to perform specific tasks on input data without using explicit instructions.  

Types of Machine Learning:

Machine Learning is sub-categorized to these four types. 

  • Supervised Learning
  • Unsupervised Learning
  • Semi-supervised Learning
  • Reinforcement Learning
1. Supervised Learning describes a class of problems in which the training data comprises examples of input vectors along with the corresponding target vectors. Supervised learning algorithms try to model mapping between the input features and the target output so that the model can predict the output values for new data based on those mapping which it learned from the previous data sets.

The two main supervised learning problems are classification and regression problems.
  • Classification: Supervised learning problem that involves identifying a class label (Categories, Discrete values).
  • Regression: Supervised learning problem that involves predicting the continuous values ( Numerical values).


2. Unsupervised Learning describes a class of problems in which the training data comprises only the input data without the output or target variables. In unsupervised learning algorithms, the model tries to extract the relationships from the input data. There are no output labels based on which the algorithm can try to model mapping or relationships.

There are many types of unsupervised learning, although two main problems that are often encountered by a practitioner are clustering and density estimation.
  • Clustering: unsupervised learning problem that involves finding the group of the same object in a data.
  • Density Estimation: It involves the summarizing the distribution of data.    


3. Semi-supervised Learning describes the class of problems where the training data contains very few labeled features (examples) and a large number of unlabeled features of input data. Therefore, semi-supervised learning problems fall somewhere in between supervised and unsupervised learning, since they use both labeled and unlabeled data for training – typically a small amount of labeled data and a large number of unlabeled data.

The main goal of the semi-supervised learning is to use all of the available input data, not just the labeled data like in supervised learning.


4. Reinforcement Learning describes a class of problems where an agent interacts with the environment and find out what is the best outcome using feedback.
The reinforcement learning algorithm learns from its experiences of the environment and takes actions that would maximize the reward and minimize the risk. It is used by many machines to find the ideal behavior within a specific situation.
The best example of reinforcement learning is playing a game where the agent has a goal of getting a high score and can make moves in the game and received feedback in terms of reward or penalty.


Monday 12 November 2018

Linear Regression Model implemented in Python for Prediction Problem

Linear Regression Model

In this article, we dive into a linear regression model.
In this post, I am going to walk you through how you can load data, build, predict, evaluate and implement Linear Regression Model in python.
I will build and evaluate the model on the Boston Housing dataset using scikit-learn.

Philadelphia Housing Dataset:

Dataset is from Philadelphia, PA and includes average house sales price in a number of neighborhoods. The attributes of each neighborhood we have include the crime rate ('CrimeRate'), miles from Center City ('MilesPhila'), town name ('Name'), and county name ('County').

Here are the topics I’m going to cover with implementation in this post.
  • Load the Data
  • Explore the Data
  • Build Linear Regression Model
  • Predict on Test Data with Model
  • Evaluation of the Prediction of the Model
  • Visualizations 
These topics are implemented in Jupyter Notebook So go through this notebook to understand the implementation of the linear regression model and its performance on predicting problems.


What is K-fold Cross Validation? Working of Cross validation on K-fold data.

In this tutorial, we will be covering the cross-validation concept, its usage in machine learning methods, and the working of k-fold cross-v...

Popular Posts